Which crypto research tool should a team choose when the problem isn't finding data, but turning the right data into a repeatable workflow? Asset discovery, market-data validation, protocol fundamentals, wallet investigation, blockchain querying, and TradingView watchlist maintenance require different layers of information.
The comparison below evaluates each resource by research job, data access, export or API support, update cadence, pricing approach, and workflow fit. It also separates generic asset tickers from venue-specific TradingView symbols. BTC identifies an asset, while EXCHANGE:PAIR, such as BINANCE:BTCUSDT, identifies a symbol on a particular venue.
That distinction matters because a research platform can have excellent market or on-chain data yet still leave analysts manually rebuilding TradingView lists. TradingList addresses that organizational task with supported, TradingView-compatible crypto symbol universes. It doesn't provide signals, predictions, portfolio advice, or financial advice. The strongest stack usually combines several tools, with each one responsible for the data layer it handles best.
Table of Contents
- 1. TradingList
- 2. Messari
- 3. Token Terminal
- 4. Glassnode
- 5. Santiment
- 6. Nansen
- 7. Dune
- 8. CryptoQuant
- 9. Arkham Intelligence
- 10. Coin Metrics
- Top 10 Crypto Research Tools Comparison
- Build a Research Stack That Matches the Question
1. TradingList
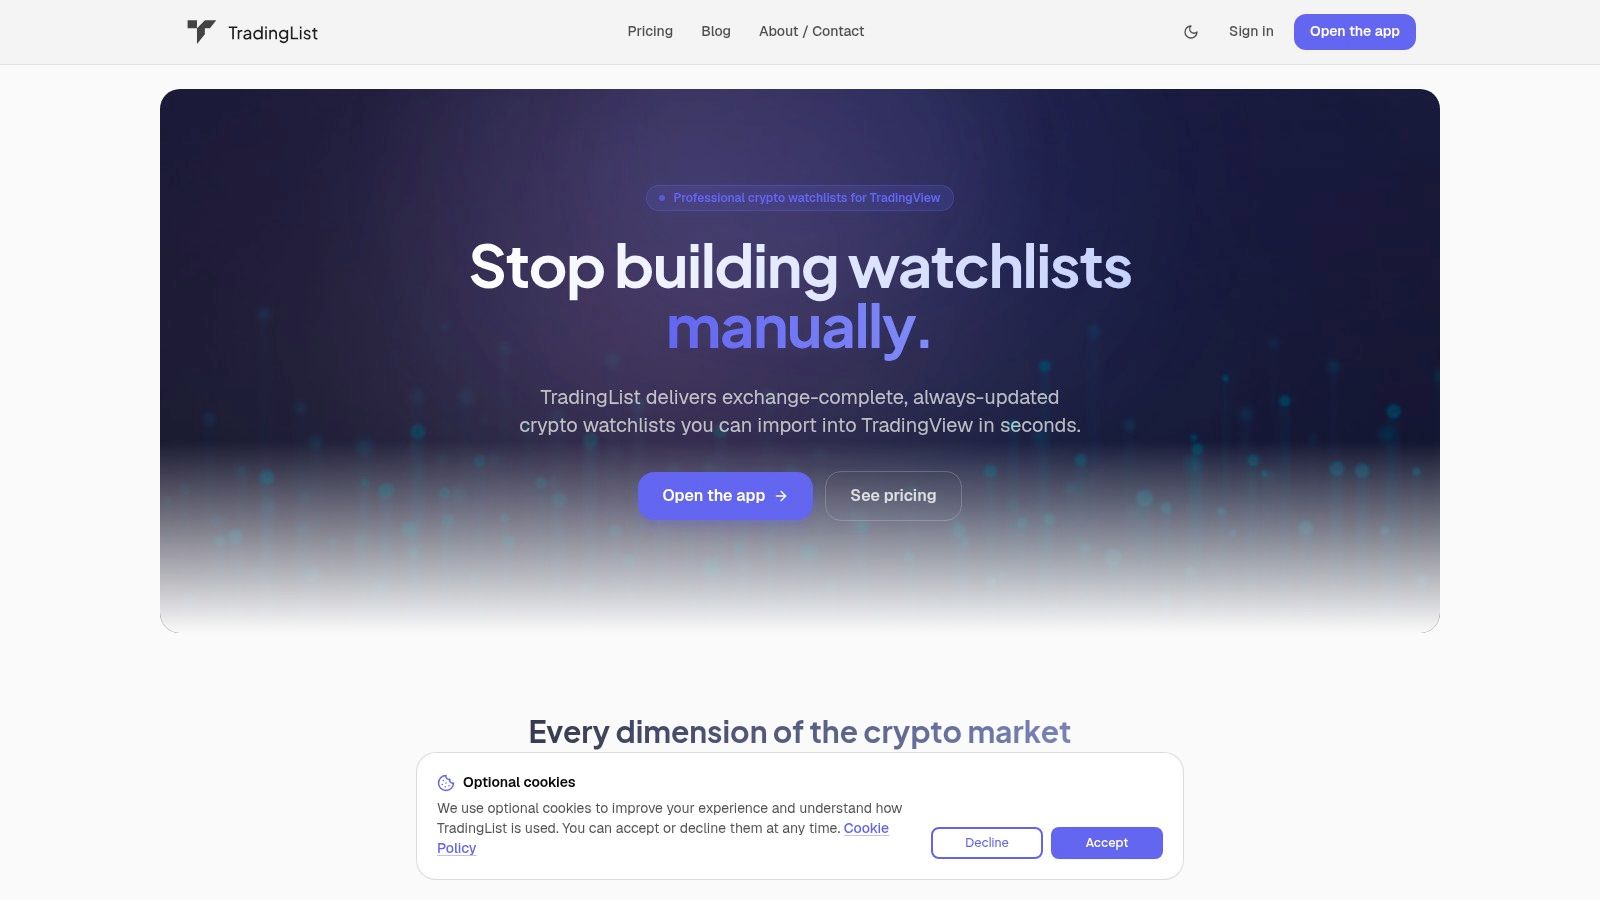
TradingList is the most workflow-specific option in this list. It focuses on organizing, filtering, comparing, combining, and exporting TradingView-compatible crypto watchlists, rather than replacing a market terminal or blockchain analytics platform. That makes it useful when the research question has already produced a universe of assets and the next task is keeping that universe usable.
Its standard watchlists are organized around supported centralized exchanges, market capitalization, categories, and ecosystems. Custom crypto watchlists narrow those supported dimensions, while ScreenerList builds symbol lists from market filters. DeltaList compares a reference list with exchange or market variants, and FusionList combines several watchlists into one exportable configuration. Custom watchlists, ScreenerList, DeltaList, and FusionList require a Premium subscription.
TradingView's own import requirements explain why formatting deserves separate attention. A watchlist import uses a .txt file, comma-separated symbols, and exchange-qualified symbols, with the upload available from the right toolbar on the platform's watchlist help page. A generic SOL ticker therefore isn't interchangeable with a venue-specific symbol such as BINANCE:SOLUSDT.
TradingList is designed to reduce that manual prefix, pair, and ticker cleanup. Its files use TradingView-compatible symbols, and its update process follows a daily refresh cycle when source data is available. The product cites CoinGecko as its market source. Users should still verify symbol availability and list contents before relying on an export for a particular research task.
Best fit and limitations
The service fits traders, research analysts, educators, scanner authors, and advanced TradingView users who need structured symbol universes. It isn't an exchange, broker, trading platform, signal provider, prediction engine, or adviser.
Strengths include:
- Venue organization: Separate lists support monitoring by centralized exchange.
- Market structure: Market-cap lists create practical size-based starting universes.
- Taxonomy: Supported category and ecosystem lists support narrower comparison sets.
- List operations: ScreenerList, DeltaList, FusionList, and Custom watchlists support filtering, comparison, and combination.
- TradingView preparation: Exports are built around exchange-qualified symbol formatting.
TradingList should be viewed as the watchlist and symbol-organization layer in a broader crypto research stack. It doesn't replace Messari for research reports, Token Terminal for protocol KPIs, or Dune for custom SQL.
2. Messari
Messari serves a different research job: structured crypto research for assets, ecosystems, governance, and events. Its enterprise-oriented platform combines asset dashboards, screeners, governance tracking, event feeds, ecosystem reporting, and AI-assisted research through Copilot and Deep Research.
The practical advantage is standardization. Teams producing internal memos, investment committee material, educational content, or client-facing decks can work from recurring “State of” ecosystem reports and consistent report formats. That structure is more useful for comparative diligence than a loose collection of social posts, project documentation, and one-off dashboards.
Messari also suits researchers who need broad L1, L2, and sector coverage in one research environment. Its screeners can help identify candidates, but the resulting asset universe still needs validation against the specific venue symbols used in a TradingView workflow. A Messari asset record and a TradingView symbol aren't automatically the same object.
Best fit and limitations
Messari is strongest when the output is a research document or standardized ecosystem view, not merely a chart watchlist. It can help answer questions about project context, governance activity, sector positioning, and recurring ecosystem developments.
The platform's current positioning is more enterprise-oriented than a simple retail subscription tool. Legacy Lite and Pro plans have been retired, while access is consolidated around enterprise offerings. Pricing is sales or quote-based and isn't publicly listed, so smaller teams should confirm access, seats, data rights, and export terms before building a process around it.
Messari also shouldn't be treated as a substitute for direct on-chain investigation. A report can establish context, but wallet-level attribution, transaction tracing, and custom chain activity require specialized tools such as Nansen, Arkham, or a SQL platform. Its role is closer to research synthesis and standardized context than raw blockchain querying.
Messari's research platform is therefore a fit for teams that value consistent analyst outputs and ecosystem coverage. It's less suitable when the primary requirement is low-cost, self-serve access to raw data or a ready-to-import TradingView watchlist.
3. Token Terminal
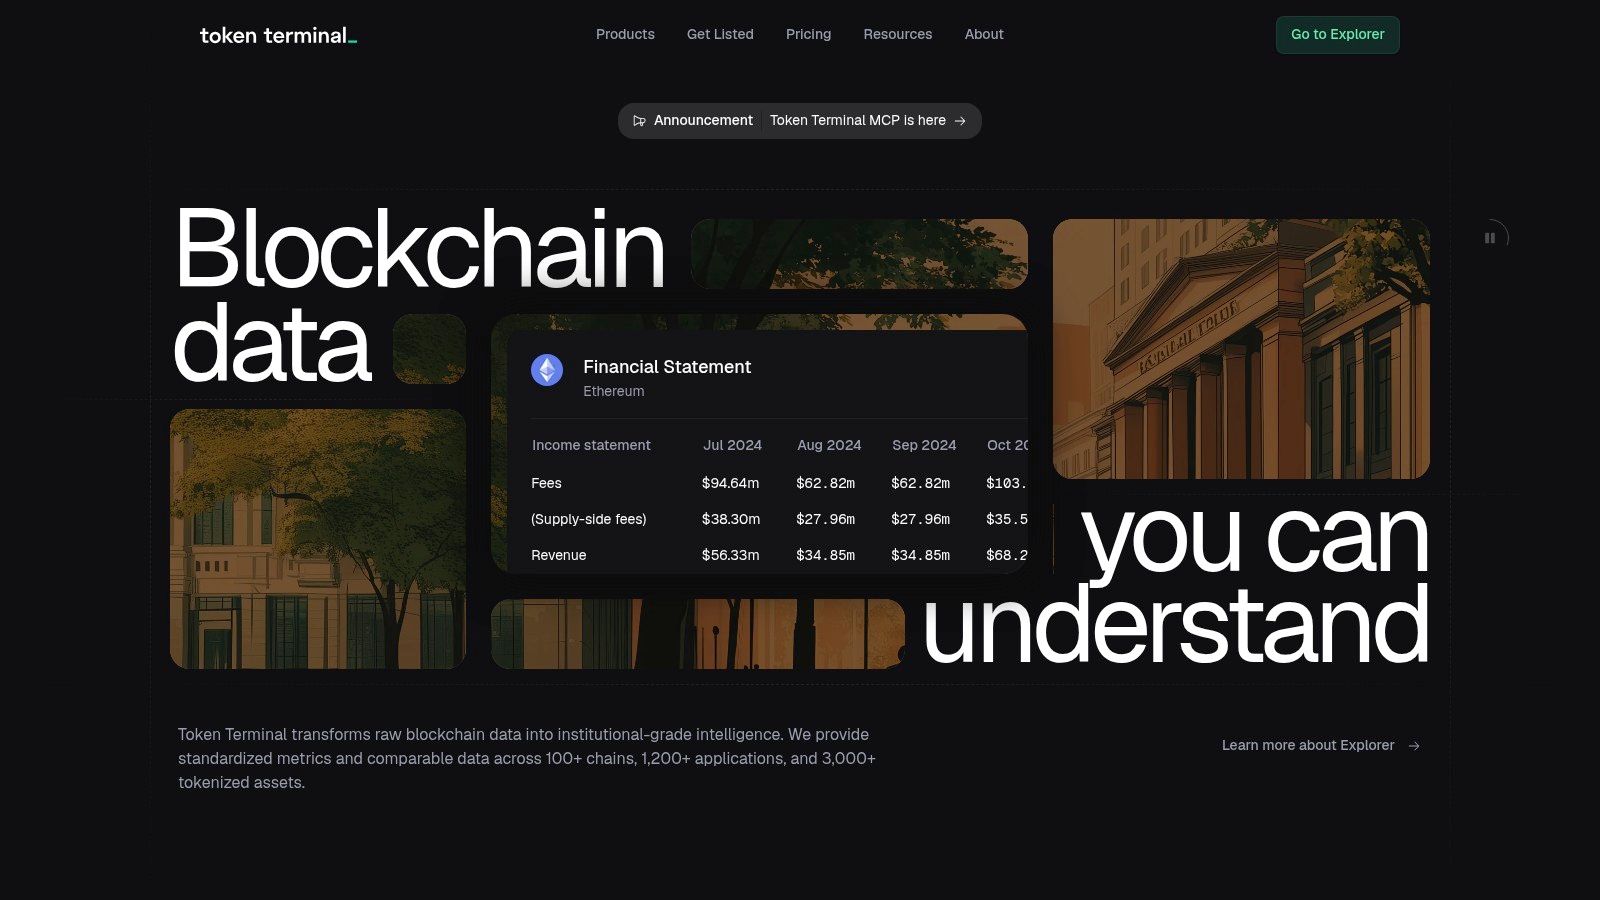
Token Terminal is built around a simple analytical premise: crypto protocols can be compared through standardized revenue, fees, usage, token incentives, and financial metrics. That makes it one of the clearest options for researchers who approach digital assets with an equity-style framework.
The web platform supports dashboards, comparable metrics, and downloadable CSV or Excel files. Programmatic users can work with a REST API, while the BigQuery Data Room provides raw and decoded multichain tables for deeper analysis. Documentation and analyst-focused support matter here because metric definitions are often more important than the chart itself.
A protocol's fee figure, revenue figure, or usage measure can mean different things across datasets. Token Terminal's value comes from applying a consistent methodology across supported projects, giving analysts a more coherent foundation for peer comparisons, KPI tracking, valuation work, and DCF inputs.
Best fit and limitations
Token Terminal fits fundamental research rather than wallet attribution or venue-specific execution analysis. It can help an analyst compare protocol economics, follow operating KPIs, and export data into a spreadsheet or a research pipeline.
Its main limitation is audience and access tier. Core data is available through a free plan, Pro has public subscription pricing, and API and Data Room plans use custom pricing. A free trial is available for evaluating whether the metric definitions and project coverage fit a team's model, but trial access shouldn't be assumed to represent full production access.
The platform also doesn't solve symbol normalization. A protocol can have a native token, several markets, and multiple venue-specific pairs. Token Terminal may provide the fundamental context, while TradingView requires a qualified symbol for the exact market being charted. That handoff should be documented rather than treated as automatic.
Token Terminal is a strong choice when the research question is, “How is this protocol performing economically?” It's not the right first choice for, “Which exchange symbols should be imported into a TradingView watchlist?”
4. Glassnode
Glassnode combines on-chain, spot, derivatives, ETF, and macro metrics in a market-intelligence environment. Its strongest use cases include cycle analysis, positioning research, risk dashboards, and detailed Bitcoin and Ethereum investigation.
The platform separates access by metric depth. Advanced users receive a broad Studio dashboard, while Professional users get a substantially larger premium metric set. Professional API access adds deeper history and higher resolution, with delivery options that include Snowflake and BigQuery for larger-scale workflows. Research dashboards such as Token Screener, Profitability Map, and Market Compass turn those metrics into more focused analytical views.
Glassnode works best when the question concerns network behavior, market structure, holder profitability, or broader positioning. It can help an analyst test whether price movement is accompanied by changes in network activity or investor behavior, but those outputs remain analytical inputs rather than trading signals.
Data access and limits
The key integration question is tier access. API capabilities and limits depend on the plan and should be confirmed against Glassnode's current offer before subscribing; Professional pricing is configurable. Teams should map the exact metrics, history, resolution, and delivery method required before selecting a plan.
Coverage also needs careful interpretation. A metric may be available for one asset or chain but not another, and the same label can carry different methodological meaning across providers. Analysts should record definitions and update cadence in research notes rather than combining similarly named metrics without checking their construction.
Glassnode's market intelligence platform belongs in the on-chain and market-structure layer. It complements a fundamentals provider such as Token Terminal and a watchlist organizer such as TradingList. It doesn't replace either one, because a metric dashboard and a venue-qualified symbol file solve different workflow problems.
5. Santiment
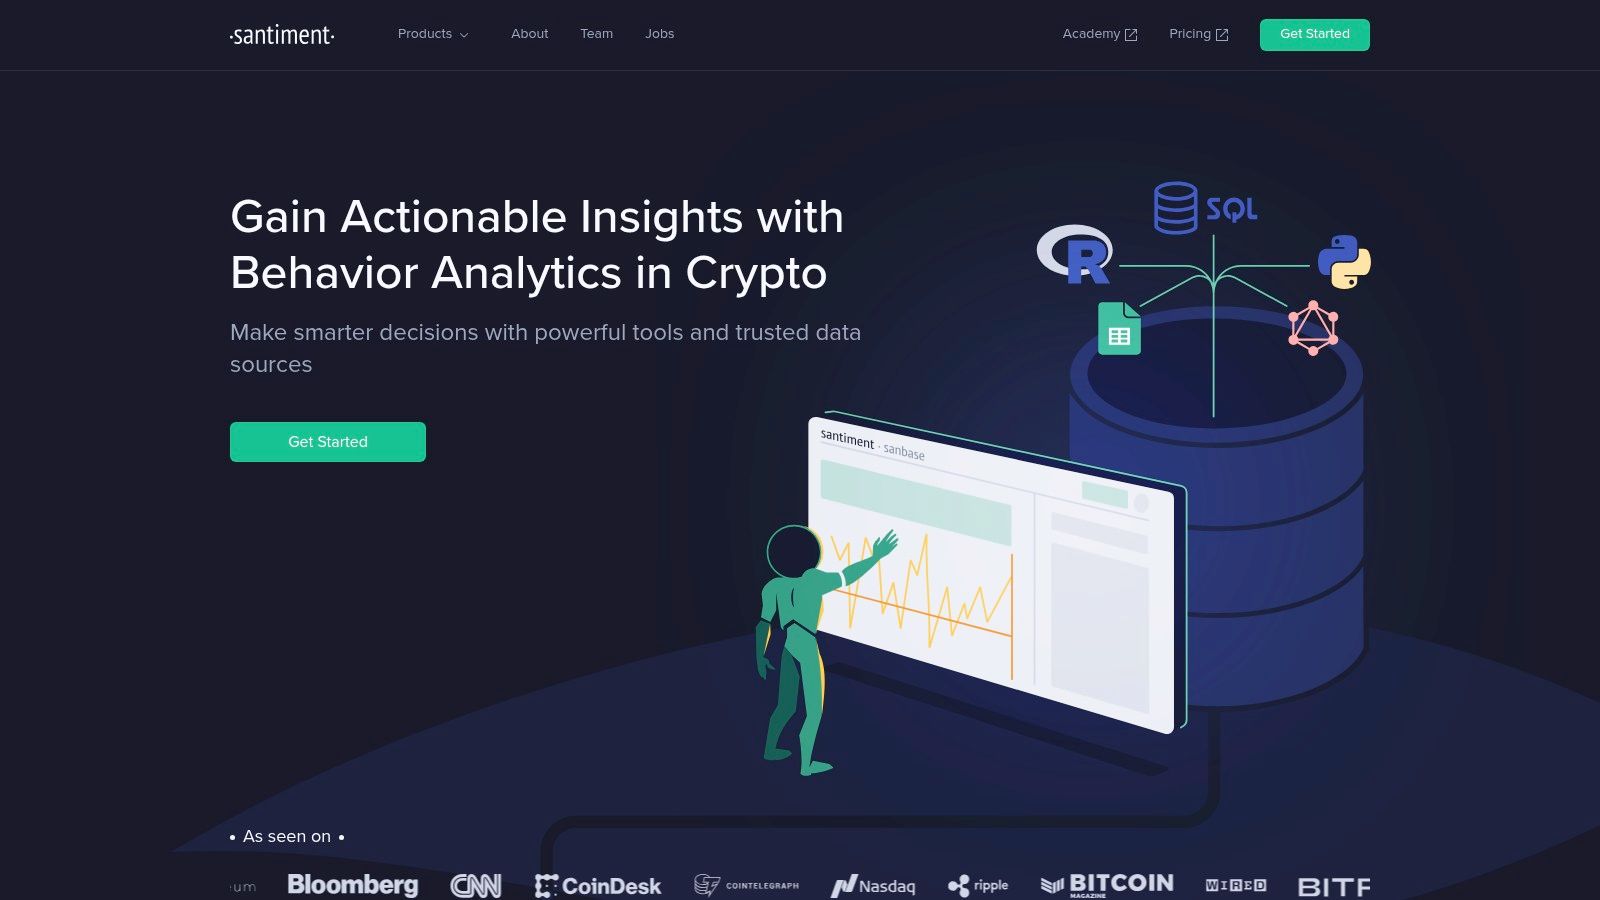
Santiment is useful when on-chain activity needs to be read alongside social attention and development activity. Sanbase brings those categories into one workspace, allowing researchers to compare network behavior with crowd discussion and project-development indicators.
Its Santiment Queries environment adds SQL-style access through ClickHouse. That matters for analysts who don't want to stop at a prebuilt dashboard. Custom queries can help define a repeatable research question, save an analytical method, and inspect how different data fields behave across supported assets.
The platform's payment structure includes data credits and plan-based rate limits, with flexible payment options that include SAN and fiat. Those details affect reproducibility. A query that works comfortably under one plan may require different scheduling or credit management under another.
A combined signal layer, not a symbol layer
Santiment can enrich research about attention, development, and on-chain behavior, but it doesn't create a TradingView-compatible watchlist by itself. A team still needs to map the resulting asset set to venue-specific symbols before charting or alert setup.
That mapping can be difficult when an asset has multiple listings, renamed tickers, wrapped versions, or inconsistent market identifiers. Researchers should preserve the original asset identifier alongside the TradingView symbol instead of overwriting one with the other.
The platform is best for analysts who value a combined social, development, and on-chain perspective. Its limitations include plan-gated access, varying data recency, and subscription-specific credits and rate limits. Those constraints should be recorded whenever a query becomes part of a recurring report.
Santiment's Sanbase platform fits the contextual analytics layer. It can sit beside a market-data source, a watchlist workflow, and a custom SQL environment, but it shouldn't be presented as a universal replacement for all three.
6. Nansen
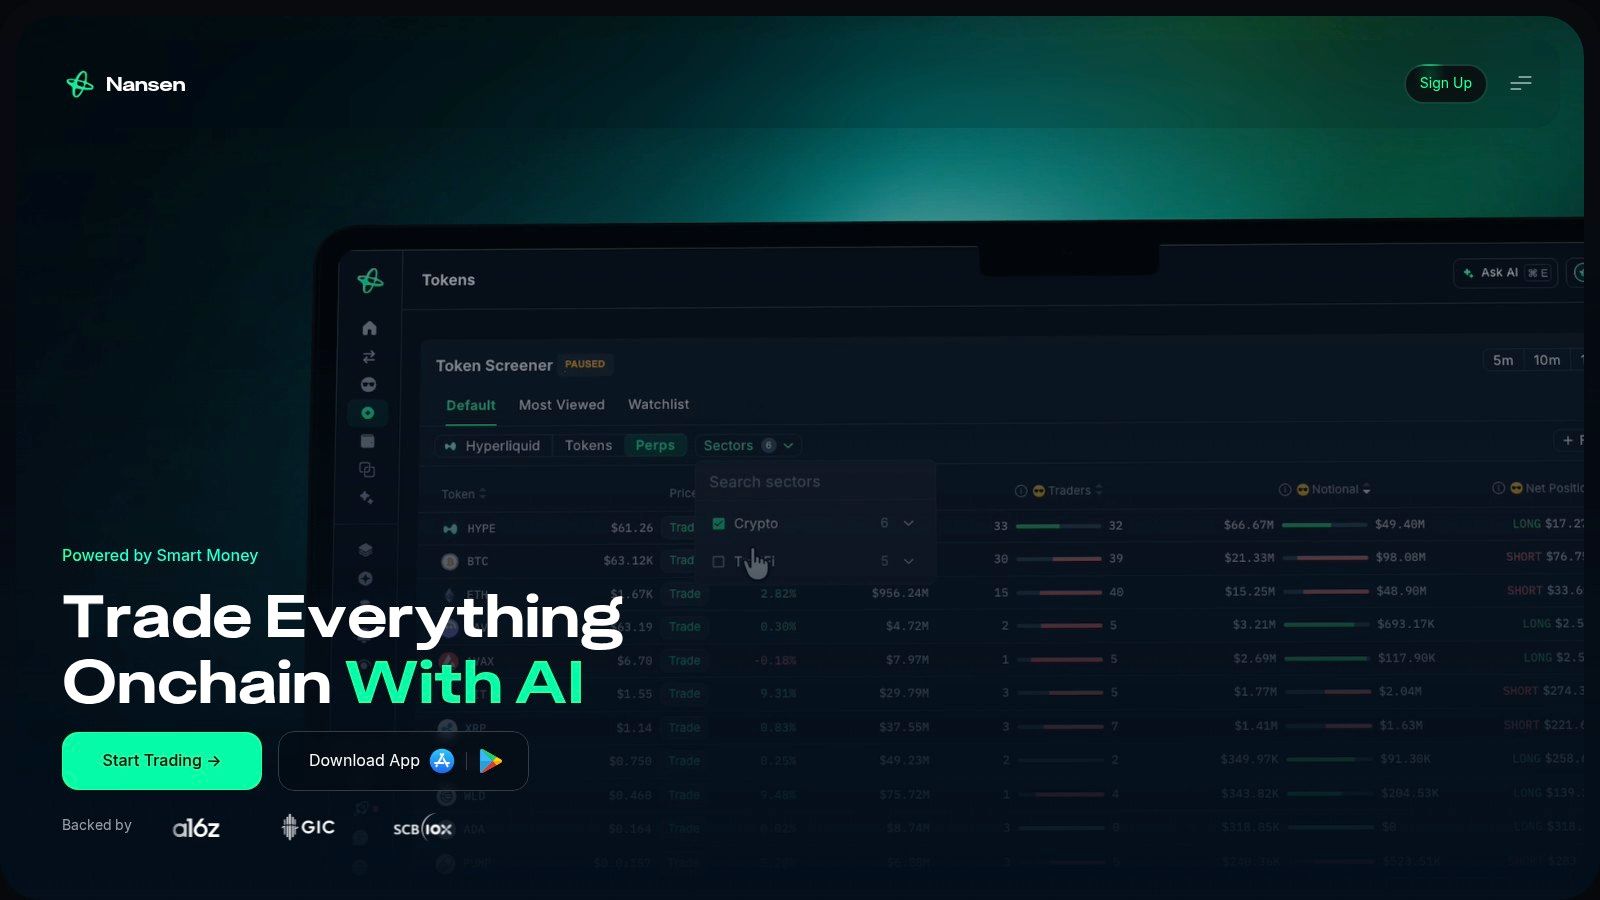
Nansen focuses on wallet labeling, entity analytics, smart-money tracking, and cross-chain activity. That makes it more appropriate for researchers asking who is moving funds, which labeled entities are active, and how flows change across networks than for analysts comparing protocol revenue.
Its dashboards combine wallet labels with entity flow analysis and alerts. API access uses credits and documented rate limits, while integration support, including Model Context Protocol support, can connect selected workflows to AI tools and external systems.
The central distinction is between an asset and an actor. A market-data provider may show volume for a token, but Nansen can help investigate the entities and wallets associated with flows. Attribution remains a methodological output that requires scrutiny, especially when labels are used in compliance, investigative, or high-consequence research.
Where it fits in a TradingView workflow
Nansen can identify a set of assets or venues that deserves further chart review. It doesn't automatically turn that set into a clean TradingView import. The analyst still needs to verify the market, exchange, pair, and symbol format.
A practical process might begin with labeled-wallet activity, narrow the asset universe, verify liquidity and venue availability through market-data tools, then create a venue-specific watchlist. TradingList can support that final organization step when the assets fit its supported exchange, market-cap, category, or ecosystem filters. Its crypto screener workflow provides related context for turning a broad market universe into a more manageable list.
Nansen's limitations concern access and scaling. Pro costs $49 per month with annual billing or $69 with monthly billing, according to Nansen's published pricing. API usage is credit-based, and teams scaling beyond individual research may need support to understand usage limits and integration terms.
Nansen is therefore best treated as an entity and flow investigation tool. It complements, rather than replaces, a market screener, a fundamentals platform, or a TradingView-compatible watchlist service.
7. Dune
Dune gives researchers a direct route from a hypothesis to a custom blockchain dashboard. Its SQL query engine runs over curated blockchain datasets, including token price tables, and its community dashboards provide working examples that can shorten the path from question to prototype.
This is a different workflow from a fixed dashboard. An analyst can define the transaction logic, select the relevant contracts, aggregate activity, and publish a visual result. Team and workspace features support collaboration, while export tooling helps move outputs into other research processes.
Dune's credit model creates a useful spending boundary. Plans use tiered monthly credits, and spend caps can help teams control query consumption. The tradeoff is that heavy queries can consume credits quickly, especially on lower tiers.
Best for reproducible custom research
Dune is strongest for researchers who can write SQL or work closely with someone who can. Community examples make the platform approachable, but copied queries still require review. A dashboard can be visually persuasive while relying on assumptions about contract classification, token identity, chain coverage, or price treatment.
Dune also doesn't solve the full symbol-management problem. A query may identify token contracts and activity, while TradingView needs a venue-qualified market symbol. Those are different identifiers and should remain separate in the research record.
Dune works well when a team needs bespoke blockchain analysis, public dashboards, and a repeatable query layer. It's less convenient for a user who only needs a maintained list of centralized-exchange symbols ready for charting.
Workflow rule: Preserve the contract address, asset identifier, and TradingView market symbol as separate fields. They answer different questions and shouldn't be collapsed into one ticker column.
8. CryptoQuant
CryptoQuant concentrates on exchange flows, miner metrics, stablecoin activity, derivatives, and market structure. Its dashboards, Quicktake feed, alerts, API, and export options support researchers monitoring changes in exchange balances, flow behavior, and market conditions.
The platform's API provides market and on-chain data with tiered rate limits and selectable resolution. CSV downloads and other exports vary by plan. Institutional services and analyst community resources add a layer for teams that need more than a personal dashboard.
CryptoQuant is especially relevant when a research process watches centralized-exchange activity. That focus makes it complementary to exchange-specific TradingView watchlists, but the two products still operate at different levels. CryptoQuant may help identify which market conditions or venues deserve attention, while a watchlist service organizes the symbols used for chart review.
Access and interpretation
Some features sit behind higher tiers, and premium plans may require annual billing. Higher-tier pricing can be restrictive for smaller users, so the practical evaluation should include required resolution, alert frequency, historical access, export permissions, and API limits.
Flow data also needs context. An exchange inflow or outflow isn't a complete explanation of market intent. Analysts should connect it with asset identity, venue, derivatives conditions, and the relevant time window rather than turning one metric into a prediction.
CryptoQuant fits the exchange-flow and market-structure layer. TradingList's cumulative volume delta guide can help readers connect flow-oriented analysis with a broader TradingView review process without treating either tool as a source of trading advice.
9. Arkham Intelligence
Arkham Intelligence is designed for entity-level on-chain investigation. Its labeled wallet activity, transfer analysis, counterparty views, risk scores, and Intel Exchange support questions about attribution, counterparties, and the movement of funds.
The Intel Exchange adds a distinctive marketplace model. Participants can buy or sell research through bounties and auctions, which broadens the potential supply of on-chain intelligence beyond a single platform's internal labeling process. That flexibility also creates a quality-control requirement. Listings and bounties can vary, and some intelligence may have exclusivity windows.
Arkham provides API access for balances, counterparties, transfers, and trades, with Risk Scores available as a paid API add-on. Its SaaS API is listed on AWS Marketplace as a procurement option; the listing states that it is not deployed on AWS.
Investigative value and ethical limits
Entity labeling can be useful in counterparty reviews and investigations, but deanonymization raises ethical and privacy questions. A label should be treated as an evidence-backed research lead, not an unquestionable identity claim. Analysts should document the source, confidence, and purpose of the attribution.
Arkham isn't a market screener or watchlist organizer. It may reveal an asset, wallet cluster, or venue that warrants further monitoring, but the final TradingView symbol still needs exchange qualification and normalization.
Arkham Intelligence is best for teams investigating who controls activity and where funds move. It complements Nansen in entity research, while Dune offers a more customizable SQL route for analysts who need to construct their own datasets.
10. Coin Metrics
Coin Metrics provides institutional crypto financial intelligence across network data, market data, reference rates, indexes, and risk datasets. Its positioning makes it particularly relevant to research teams building backtests, benchmark datasets, valuation models, and production data pipelines.
The Community API offers a limited entry point, while Network Data Pro provides paid access to broader metrics. Reference Rates and index products support benchmarking, and the Python client, documentation, and tutorials help analysts connect the data to existing workflows.
Methodology transparency is a major consideration for institutional research. A dataset used in a model needs more than a convenient endpoint. Teams need consistent definitions, documented calculation methods, and API conventions that can be retained in an audit trail.
Integration and symbol discipline
Coin Metrics is a data vendor, not a TradingView watchlist service. Its market identifiers and reference-rate conventions may not match the venue-specific symbols required by a charting platform. The analyst must maintain a mapping layer that records the asset, market, exchange, quote currency, and TradingView format.
That distinction is central to crypto ticker symbols. A ticker can be ambiguous across venues, while EXCHANGE:PAIR identifies a particular TradingView market. Symbol normalization should happen before imports, alerts, or cross-platform comparisons.
Coin Metrics fits teams that need benchmark-quality data and reproducible integrations. Its limitations are its institution-focused Pro pricing, which is quote-based, and the Community API's limited history and resolution for non-commercial use.
Top 10 Crypto Research Tools Comparison
| Product | Core offering | Best for / Target audience | Unique selling points | Pricing & access |
|---|---|---|---|---|
| TradingList (recommended) | Ready-to-import TradingView-compatible crypto watchlists (exchange, market-cap, category, ecosystem) | Retail & professional TradingView users, researchers, educators, scanner authors | Pre-formatted .txt exports; Premium tools: ScreenerList, DeltaList, FusionList, Custom filters; daily refresh; auto-splits >1,000 symbols | Free guest browsing; one-time lists from $2.99 without a subscription; Lite $6/mo · Plus $12/mo · Premium $18/mo (monthly billing); advanced tools and Custom watchlists require Premium |
| Messari | Institutional research portal with asset dashboards, screeners, governance tracking and AI assistants | Enterprise research teams, diligence, client-facing reports | Standardized "State of" reports; Copilot/Deep Research AI assistants; vetted research formats | Enterprise / quote-based pricing (no public list) |
| Token Terminal | Standardized protocol fundamentals, revenue/fee metrics, API and BigQuery data room | Analysts doing fundamentals, valuation comps, DCFs and KPI tracking | Clean financial-style metrics; REST API; BigQuery "Data Room" for raw multichain tables | Free core-data plan; Pro with public subscription pricing and a free trial; API/Data Room by quote |
| Glassnode | On-chain, spot, derivatives and macro metrics with dashboards and APIs | Cycle analysis, BTC/ETH deep research, institutional risk dashboards | Large metric catalog (300–1,500+); Professional API; Snowflake/BigQuery delivery | Tiered plans (Advanced/Professional); API availability, limits, and add-ons depend on the current plan |
| Santiment (Sanbase) | Combined on-chain, social and development metrics with SQL/ClickHouse access | Analysts blending on-chain flows and social sentiment | Santiment Queries (ClickHouse/SQL); social + on-chain fusion; flexible payment methods | Tiered plans with data credits and rate limits; fiat or SAN token payments |
| Nansen | Entity & wallet labeling, smart‑money tracking and flow analytics with alerts | Traders and investigators monitoring whales, funds, rapid rotations | Deep wallet labeling; entity flow alerts; API with AI integrations | Pro: $49/mo billed annually or $69/mo billed monthly; API credit-based access |
| Dune | Community-driven SQL analytics over curated blockchain datasets and public dashboards | Analysts building custom dashboards, hypothesis-to-dashboard workflows | Fast SQL → dashboard path; rich community examples; tiered credit model | Credit-based tiers (Analyst, Plus, Enterprise) with monthly pricing |
| CryptoQuant | Exchange flows, miner metrics, stablecoin activity and derivatives data with alerts | Traders timing market inflections and risk managers | Quicktake feed and alerting; clear plan matrix; institutional services | Tiered plans with credits; higher tiers often annual and pricier |
| Arkham Intelligence | Entity-level deanonymization, labelled wallets and an on-chain Intel Exchange | Investigators, compliance, attribution and counterparty analysis | Intel Exchange marketplace; strong entity labeling; API and token incentives | API/enterprise access; marketplace pricing varies; ARKM token incentives |
| Coin Metrics | Institutional network and market data, reference rates and benchmark indexes | Institutions needing benchmark-quality data, backtesting pipelines | Transparent methodology; reference rates and indexes; client libraries | Community API (free, limited); Pro/enterprise priced by quote |
Build a Research Stack That Matches the Question
The right crypto research tools depend on the layer being investigated. TradingList belongs in the symbol-organization layer, where researchers need supported, TradingView-compatible universes arranged by centralized exchange, market cap, supported category, or ecosystem. It doesn't provide market predictions, signals, portfolio recommendations, or financial advice.
For protocol economics, Token Terminal is the more direct fit because it focuses on standardized revenue, fees, incentives, usage, and financial metrics. Messari adds structured ecosystem research, governance context, screeners, and recurring reports. Those tools help explain what a project is doing and how it compares with peers, but they don't automatically produce the venue-specific symbols needed for TradingView.
On-chain and entity questions require a different choice. Glassnode is suited to network and market-structure metrics. Santiment combines on-chain information with social and development context. Nansen and Arkham focus more directly on wallet labels, entities, counterparties, and flows. CryptoQuant emphasizes exchange flows, stablecoins, derivatives, and related market data. Dune and Coin Metrics become more important when analysts need custom SQL, documented APIs, benchmark datasets, or repeatable data pipelines.
A practical workflow can keep these layers from becoming confused:
- Define the research object: Decide whether the output concerns an asset, protocol, wallet, entity, blockchain, exchange, or TradingView market symbol.
- Verify definitions: Record what each metric means, which chains or venues it covers, and whether the source is raw, decoded, standardized, labeled, or modeled.
- Check update cadence: Note whether the relevant data arrives through a daily refresh cycle, scheduled dashboard update, API interval, or another documented process.
- Normalize identifiers: Keep contract addresses, generic tickers, asset IDs, exchange names, quote currencies, and
EXCHANGE:PAIRsymbols in separate fields. - Record plan limits: Capture API credits, query credits, rate limits, history, resolution, export permissions, and pricing terms before making the workflow recurring.
- Import selectively: Send only the relevant watchlists into TradingView instead of importing every available asset and creating a noisy research environment.
TradingView's own crypto screener exposes tens of thousands of crypto pairs and fields including price, 24-hour change, market cap, circulating supply, 24-hour volume, volume-to-market-cap ratio, social dominance, category, technical rating, and exchange, as shown in its crypto screener. Its broader data coverage reports direct access to 3,539,722 instruments through hundreds of data feeds, according to TradingView's data coverage page. Those figures illustrate the scale of the symbol universe, but scale alone doesn't create a usable shortlist.
TradingView's watchlist tools can analyze lists by symbol type, sector, exchange, and currency in Advanced view, while its screener workflow emphasizes moving from screen to shortlist, chart, watchlist, and alert. The practical implication is that workflow design matters as much as tool selection. A maintained Standard watchlist may be enough for recurring exchange or market-cap monitoring. A Custom watchlist can narrow a supported category or ecosystem. ScreenerList can turn market filters into a symbol list, DeltaList can compare a reference universe with exchange or market variants, and FusionList can combine several lists before export.
The broader market supports this structured approach. Market Intelo estimated the global blockchain analytics market at $5.4 billion in 2025 and projected $29.8 billion by 2034. The same source reported software at 68.2% of the market and BFSI at 42.3% of revenue share, suggesting institutional use is an important part of the category's expansion. These figures don't mean every researcher needs an enterprise platform. They do show why data access, compliance, investigation, and market surveillance now sit alongside retail charting in the crypto research-tools field. Market research on blockchain analytics provides that market context.
The final output should remain a research input, not a trading signal or financial recommendation. A clean watchlist can improve organization, but it can't validate a thesis, guarantee data quality, predict prices, or replace independent analysis.
TradingList provides maintained, TradingView-compatible crypto watchlists organized by supported centralized exchanges, market-cap tiers, categories, and ecosystems, along with Custom watchlists, ScreenerList, DeltaList, and FusionList for narrower workflows. Visit TradingList to review the available symbol-list options and build a more organized TradingView research environment.